Market Update: Similar Theme
US equity indexes were mixed on the week: S&P 500 -0.8%, NASDAQ +0.1%, and DJIA -1.2%. The VIX Index is subdued at 17.1. In contrast, bond market volatility continues, with the BoA MOVE Index higher than last Friday at 130 as US regional banking troubles continue. On Monday, regulators seized First Republic Bank and struck a deal to sell the bulk of it to JPMorgan. JPMorgan said it will assume all of First Republic’s $92 billion in deposits—insured and uninsured.
The Fed hiked its policy rate 25bps as expected and signaled a "hawkish pause". In total, the Fed has hiked 500bps since March 2022. In its policy statement, the Fed remained data dependent. A potential pause was signaled when the Fed changed its language to "In determining the extent to which additional policy firming may be appropriate to return inflation to 2 percent over time..." The March statement said the FOMC "anticipates that some additional policy firming may be appropriate."
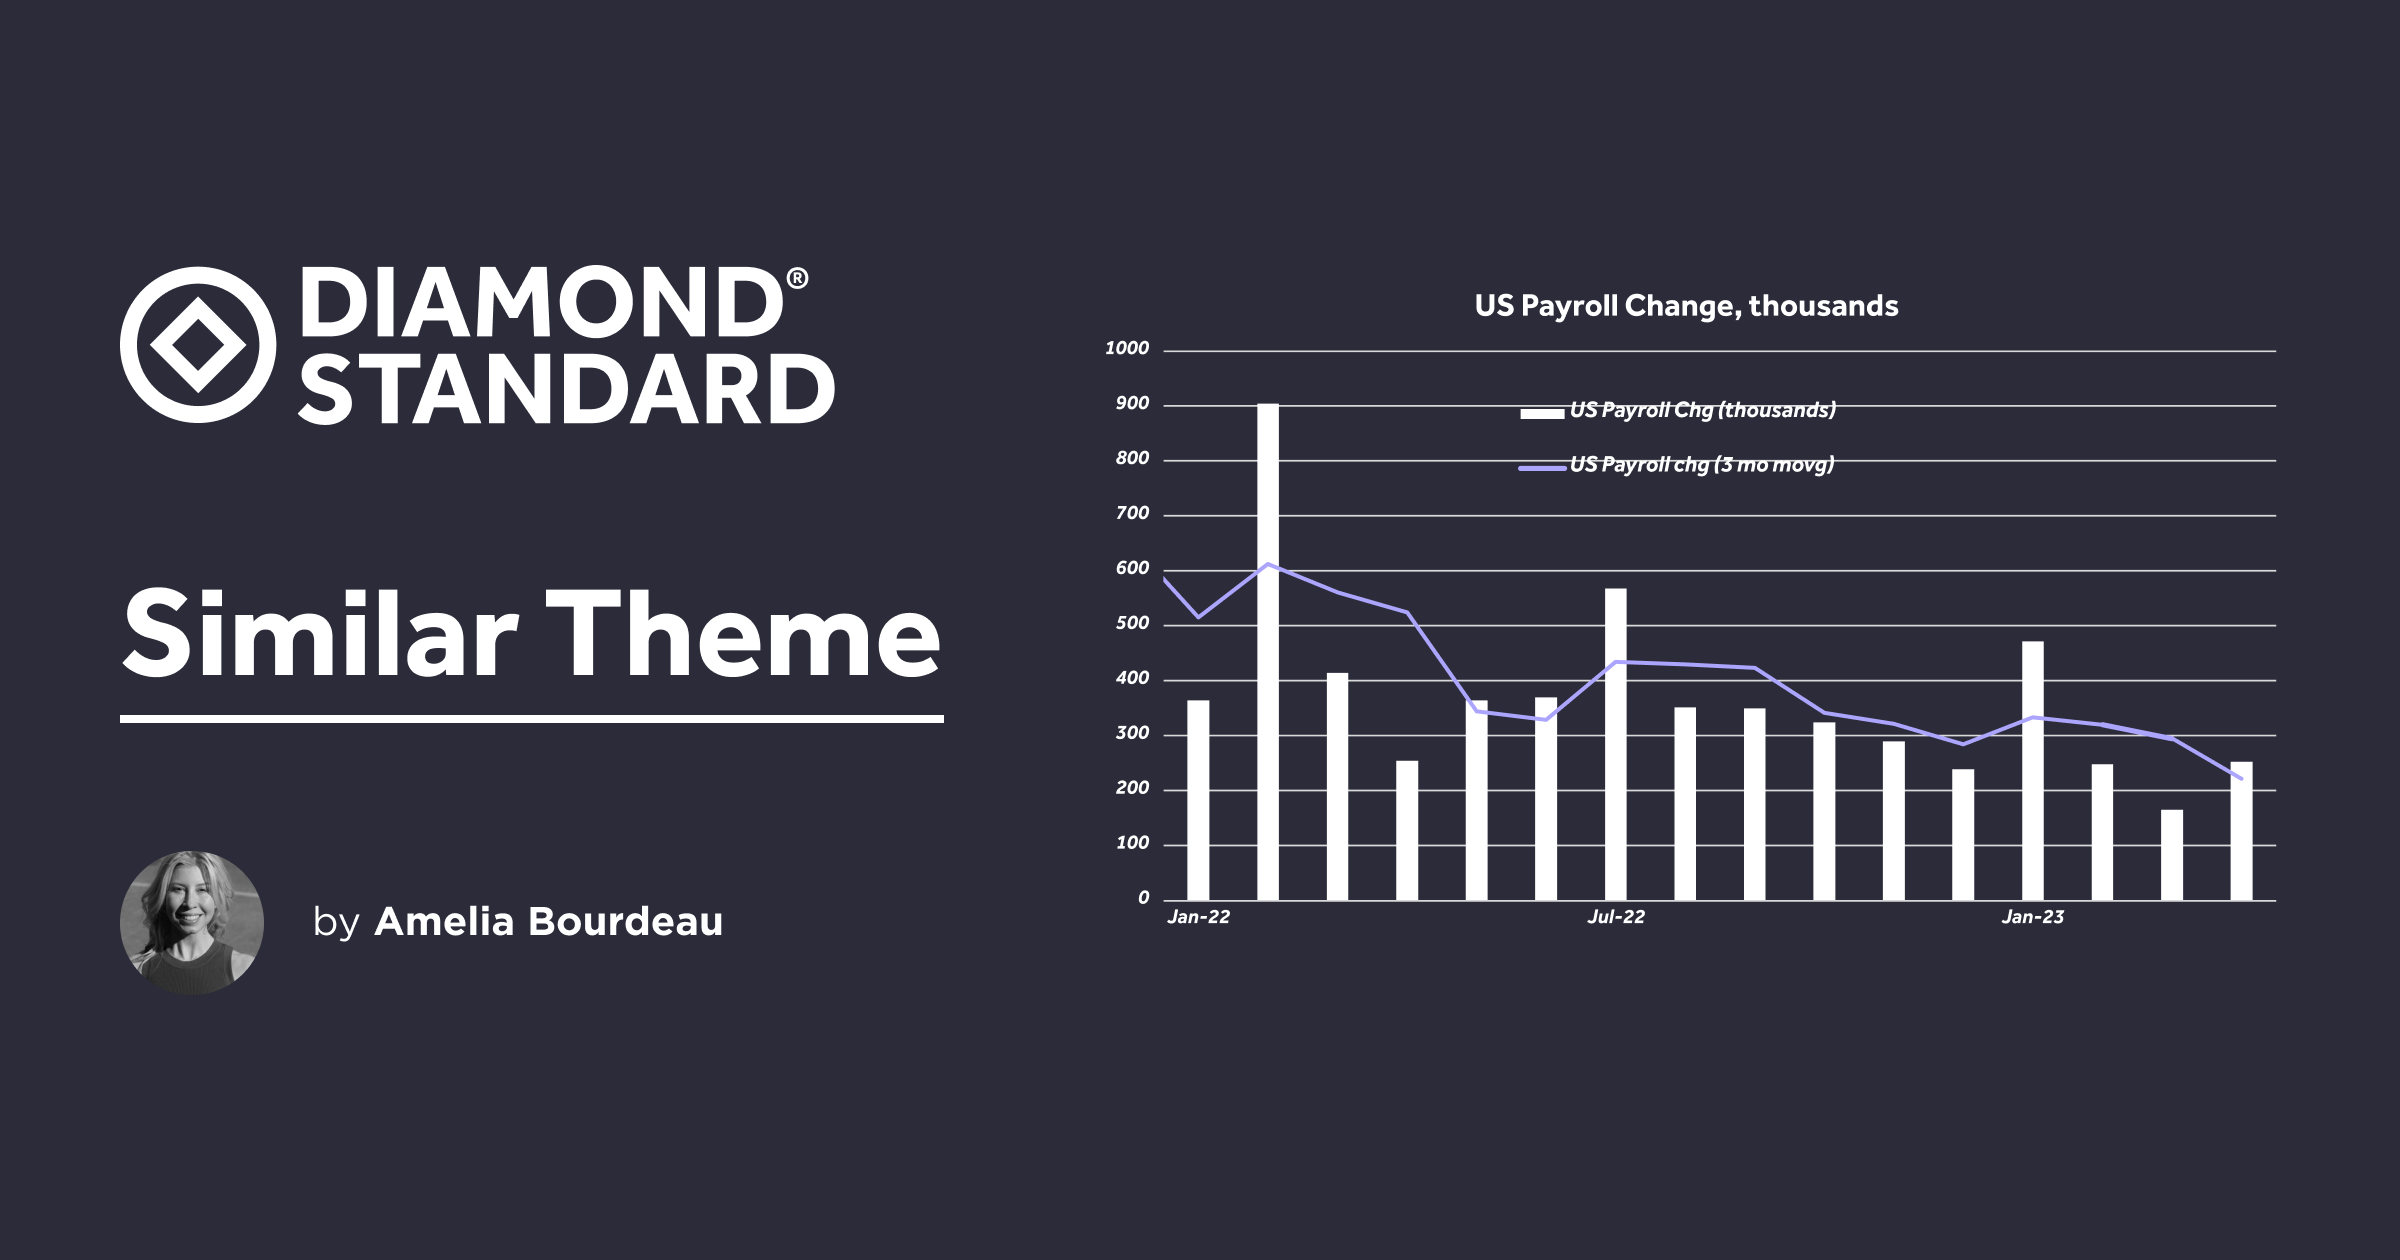
On the data front, US April payrolls rose an above consensus 253k. There were net downward revisions of 149k from the prior two months. The unemployment rate ticked down to 3.4% from 3.5%. Average hourly earnings advanced 0.5% m/m which was also an upside surprise. US job gains continue to be good news, allowing the economy to, so far, avoid recession. However, the job market's strength makes the Fed's job to fight inflation more difficult.
Fed Pricing:
Fed funds futures show the peak in the terminal rate as now - in May - and have approximately 100bps of rate cuts priced in by the end of January 2024. As we have pointed out previously, this differs markedly from the Fed's own forecast which has a median fed funds rate of 5.10% through year end 2023.
So far this month the market themes are similar to those of March and April - solid US payroll growth with bond market volatility due to US regional bank troubles.
__Chart: US Payrolls - monthly change and 3 month moving average. The moving average has ticked down but remains robust. __

Precious Metals:
DIAMINDX fell on the week to USD 5,160. This is its lowest level since March 2021. DIAMINDX peaked in March 2022 - a month after Russia invaded the Ukraine. DIAMINDX had a large run up from late 2020 through 2021 as a result of strong consumer spending on luxury goods, including diamond jewelry, during the pandemic. So far this year, continued rising prices have weighed on consumer discretionary spending and US economic uncertainty has made jewelry retailers cautious about buying inventory. Though falling, prices are adjusting or normalizing back to a pre-pandemic level. There are some large Las Vegas jewelry shows coming up which could help gauge demand ahead in H2.
As mentioned above, it looks as though May (right now) is the peak in the fed funds rate. This chart looks at how DIAMINDX has fallen post the peak when the Fed starts cutting rates and rebounds shortly after a recession period ends.
In diamond industry news, the Natural Diamond Council ("NDC") recently released a study on diamond facts to counter some misperceptions about the industry. There is a lot to unpack in the study. In this week's note, we highlight the disparity between natural diamond prices and lab growth diamond prices, which reflects both the increased supply of lab-grown diamonds as that market expanded and also the rarity of natural diamonds. The NDC notes "There is a widening price differential between laboratory-grown diamonds and natural diamonds. Prices for laboratory-grown diamonds have fallen from 2016 to 2023. For example, in some cases the price of a 1 carat stone has fallen by over 70%."
Chart: Sample prices of man-made diamonds relative to natural over 7 years

Gold and Silver
Gold was supported this week on the US regional banking sector turmoil given its safe have status (chart below). This took gold back above USD 2,000 to a high of USD 2,050 on Thursday. Gold backed off to USD 2,017 on Friday due to a solid US payrolls report and a bit of recovery in the US regional bank index. Gold gained 1.4% on the week.
The World Gold Council ("WGC") released its Gold Demand Trends Q1 2023 report. Gold demand was a mixed picture in Q1. Gold demand from central banks "experienced significant growth during the quarter." They added 228t to global reserves. Bar and coin investment rose 5% y/y to 302t. There was net negative demand for ETFs at -29t. WGC noted that global jewelry consumption was "virtually flat at 478t" and that "high and volatile gold prices proved challenging for jewellery consumers in several markets, most notably India, which saw the weakest Q1 since 2020."
Silver reached a high of USD 26.05 on Thursday before backing off to USD 25.64 on Friday. It gained 2.4% on the week. It is now trading in a USD 26.00 - USD 25.00 range. The decisive topside break of the USD 25.00 area of consolidation was important.
Chart: US Regional Bank Index (rs) vs Gold (inverted, ls)

__USD __
The USD (DXY Index) was down 0.2% on the week to 101.49 at the time of writing. The DXY Index has been trading in a tight 102.40-101.00 range since mid-April. A number of mixed factors are keeping the USD within that range: US regional bank troubles, solid US economic data, and lack of certainty regarding future Fed monetary policy moves. With a mix of both positive and negative factors, the USD has not been able to break out decisively in either direction - up or down.
Within the G10, AUD was the strongest currency vs USD on the week. AUDUSD gained 1.9% as the RBA unexpectedly hiked its policy rate. The ECB hiked its policy rate 25bps as expected. However, EURUSD fell 0.14% on the week on a combination of a solid US payroll report and perhaps some doubt as to whether the ECB, which remains hawkish in the face of a likely Fed pause, can continue to chart its own course.
Chart: USD (DXY Index) vs US 2 year yield

Ahead next week:
The US CPI for April is the big release coming on Wednesday as the market awaits another inflation reading. U of Michigan sentiment and inflation expectation readings will be released on Friday for May. Last month, the 1 year inflation expectations spiked, so there will be a focus on that data point.
Sign Up for Market Commentary: Weekly insights on global markets and commodities from Diamond Standard by Amelia Bourdeau
Disclaimer:
This report has been prepared by the Strategy Team of Diamond Standard Inc. (“Diamond Standard”). This report, while in preparation, may have been discussed with or reviewed by persons outside of the Strategy Team, both within and outside Diamond Standard. While this report may discuss implications of legislative, regulatory and economic policy developments for industry sectors, it does not attempt to distinguish among the prospects or performance of, or provide analysis of, individual companies and does not recommend any individual security or an investment in any individual company and should not be relied upon in making investment decisions with respect to individual companies or securities.
Opinions and estimates offered constitute our judgement and are subject to change without notice, as are statements of financial market trends, which are based on current market conditions. Under no circumstances does the information contained within represent a recommendation to buy, hold or sell any security, and it should not be assumed that the transactions discussed were or will prove to be profitable.